Stewardship meets strategy:
The story behind it
Iowa’s plan to keep nutrients in check
If you’ve ever tried to solve a big problem, you know this much is true: you don’t start by guessing. You start by analyzing the issue and using data and metrics to guide the path forward.
That’s the challenge Iowa faces when it comes to nutrient loss. Nutrients are essential for growing, whether that’s for crops in a field or lawns to be green. But when they leave the soil and end up in rivers and streams, it becomes a water quality problem. Reducing that loss isn’t about a single practice, a single tool, or a single group of people. It’s about understanding what’s happening on the land, tracking how that adds up across the state, and using science to make better decisions going forward.
That’s where three key pieces come in: the INREC Nutrient Reduction Survey, the Iowa Nutrient Reduction Strategy (INRS) Dashboard, and the N-FACT nitrogen decision tool. On their own, each one does something important. Together, they form a cycle that turns real-world farming practices into real progress.
Let’s walk through how it all works.
The Big Picture
Iowa’s Nutrient Reduction Strategy sets an ambitious goal: reduce nitrogen and phosphorus losses by 45 percent. First released in 2013, the strategy was created to address nutrients leaving Iowa fields and ultimately traveling downstream through the Mississippi River system to the Gulf of Mexico. It’s a long-term effort, and progress doesn’t happen overnight. Weather changes, markets change and farming practices evolve, while water quality responds slowly, especially at large scales.
So how do you know if you’re moving in the right direction?
You measure what’s happening on the land. You measure what’s happening in the water. And just as importantly, you connect the two.
That connection starts with the people closest to the land. In 2015, the Iowa Nutrient Research & Education Council (INREC) was formed to support, monitor, and report on progress toward the strategy through science-based solutions and collaboration across Iowa’s agricultural production system.
Measuring on the Farm (The INREC Survey)
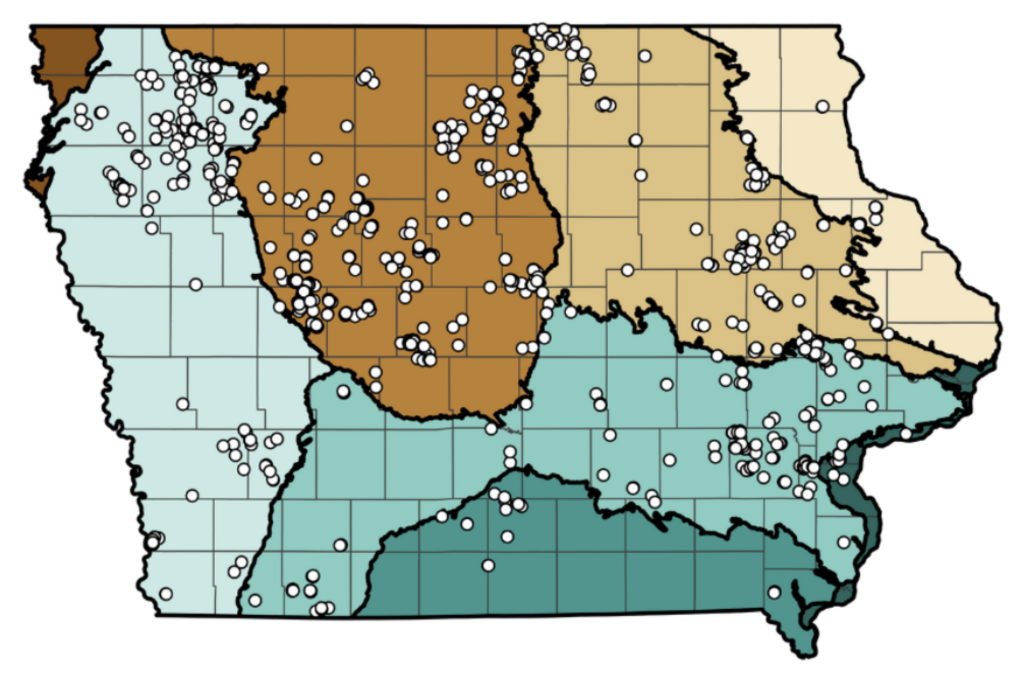
Since 2017, the Iowa Nutrient Research & Education Council (INREC) has been conducting a statewide nutrient reduction survey. Instead of asking farmers to self-report field-by-field, the survey works through ag retailers, the people who see nutrient management decisions play out across millions of acres every year.
Each year, a randomly selected group of agronomy retail locations are visited. For each location, data is collected from randomly selected fields. That information is then sent to Iowa State University’s statistics department, where it’s carefully weighted and analyzed to reflect farming across the state.
What makes this survey special is its level of detail. It captures how nutrients are managed in real life including; nitrogen rates, timing of application, use of inhibitors, cover crop usage, tillage practices, crop rotation, manure use and phosphorus placement and soil testing. These are things that don’t always show up in sales data or national surveys, but they matter a lot when it comes to nutrient loss.
With over eight years of data, the survey has revealed important trends. Cover crop acres have more than doubled. Soil sampling and phosphorus application have become more precise. Nitrogen timing shifts year-to-year, often influenced by weather and economics. Some practices move steadily forward, while others flatten out or fluctuate.
The key takeaway isn’t perfection—it’s progress, context, and credibility. The INREC Nitrogen Reduction Survey tells us what’s actually happening on the ground, not necessarily what we hope is happening.
Connecting the Dots (The INRS Dashboard)
Of course, no single dataset can tell the whole story. That’s where the INRS Dashboard comes in.
Developed through a partnership between Iowa State University, the Iowa Department of Agriculture and Land Stewardship, and the Iowa Department of Natural Resources, the Dashboard brings together data from many sources into one interactive, public-facing platform.
Think of it as the “connective tissue” of Iowa’s nutrient story. The INRS Dashboard follows a logic model. On one end are inputs like funding, staff, and educational efforts. In the middle are changes on the land, including practices tracked by the INREC survey, conservation programs, and structural practices like wetlands or bioreactors. On the other end is what everyone ultimately cares about: water quality.
By showing all of this together, the Dashboard helps answer a critical question: How do changes in management relate to changes in water?
Users can explore trends over time, toggle data on and off, and zoom in on specific practices or funding sources. You can see how cover crop adoption has grown. You can track conservation funding increases. You can examine nitrogen loads normalized for rainfall, which matters a lot in a state where wet years can overwhelm even the best management.
Importantly, the Dashboard doesn’t claim instant results. It recognizes that water quality responds slowly and that scale matters. Smaller watersheds may show improvement sooner than large rivers. Wet years can mask progress. Dry years can exaggerate it.
The strength of the Dashboard is transparency. It doesn’t oversimplify. It shows the complexity, while still making the information usable and it relies heavily on the kind of field-level insight the INREC survey provides.
Using Data to Guide Decisions (N-FACT)
So far, we’ve talked about measurement and tracking. But progress doesn’t happen just by looking backward. It happens when people use what they’ve learned to make better decisions going forward.
That’s where the N-FACT platform comes in.
Developed through the Iowa Nitrogen Initiative, N-FACT is a nitrogen decision support platform built on thousands of on-farm trials conducted with farmers across Iowa. These aren’t small plot studies tucked away at research farms. They’re variable-rate trials embedded in real operations, using modern equipment and real management conditions.
The result is a massive dataset showing how optimum nitrogen rates vary across landscapes, years, weather patterns, and management systems. N-FACT offers two ways to explore that information.
The first lets users view actual trial results: optimum nitrogen rates, yields, and nitrogen efficiency from real fields. You can see the range, not just an average. Some fields need much less nitrogen than expected. Others need more. Efficiency varies widely.
The second uses a sophisticated process-based model to explore “what if” scenarios. What if the spring is wet? What if planting is delayed? What if residual soil nitrogen is high? Users can adjust assumptions and see how those factors shift nitrogen needs.
If this sounds familiar, it should. It’s similar to how weather forecasts work. Models don’t predict the future perfectly, but when they’re fed good data, they provide valuable guidance. That’s what N-FACT does. It doesn’t dictate a single rate across the board, it helps users understand risk, variability, and opportunity.
And those better decisions, made field-by-field, are what show up later in surveys and statewide tracking.
From Insight to Action
Here’s where the story comes full circle.
Farmers and advisers (agronomists) use tools like N-FACT to fine-tune nitrogen management. Those decisions affect rates, timing, and efficiency. The INREC survey captures those changes over time, providing verified, field-level data. That data feeds into the INRS Dashboard, which shows how practice changes, investments, and education relate to water quality trends across the state.
The Dashboard then highlights where progress is happening and where challenges remain. That insight helps guide future research, funding, outreach, and tool development, including improvements to N-FACT itself.
It’s not a straight line—it’s a loop. Measure. Learn. Adjust. Measure again. This cycle is what makes long-term improvement possible.
Making Progress, Step by Step
Big environmental challenges don’t have quick fixes. They require patience, honesty, transparency and collaboration.
Iowa’s approach recognizes that farmers are managing risk every growing season. Weather, markets, and biology don’t follow scripts. By grounding decisions in real data, by being transparent about progress and setbacks, and by continually improving the tools available, the system builds trust.
This is where stewardship meets strategy. Care for the land is paired with measurement and backed by data. Progress is driven not by a single practice or a single year, but by many small, informed decisions repeated over time and shared across the system.
That’s how Iowa is turning numbers into knowledge, and knowledge into action.
If you’d like the entire webinar experience, you can watch the full recording below.